Sea Surface Temperature (ENSO)
In the Rainfall section, we saw the importance of rainfall anomalies in determining levels of fire activity in Central Kalimantan. This section focuses on the potential to use Sea Surface Temperature (SST) to predict fire activity several months in advance. If we can predict rainfall behavior in Indonesia, it is also possible to predict the severity of fire activity. The goal is to understand the relationship between Sea Surface Temperature and fire activity in Central Kalimantan and to enable the use of the “Predicting Fire Activity” tool presented in the IRI Map Room to assess seasonal fire risk.
We previously saw how SSTs are related to ENSO and climate over Indonesia. In this exercise, we will understand how to relate Sea Surface Temperature with fire activity.
Understanding the Data
What information is needed?
Based on our understanding of ENSO’s strong impact on rainfall in Indonesia, we can use SST and fire data to create a model for forecasting fire activity in the upcoming dry season. The strength of the forecast model comes from the predictable nature of ENSO (once an event has begun) which allows us to use current NINO4 data to forecast the number of fires one to two months in advance.
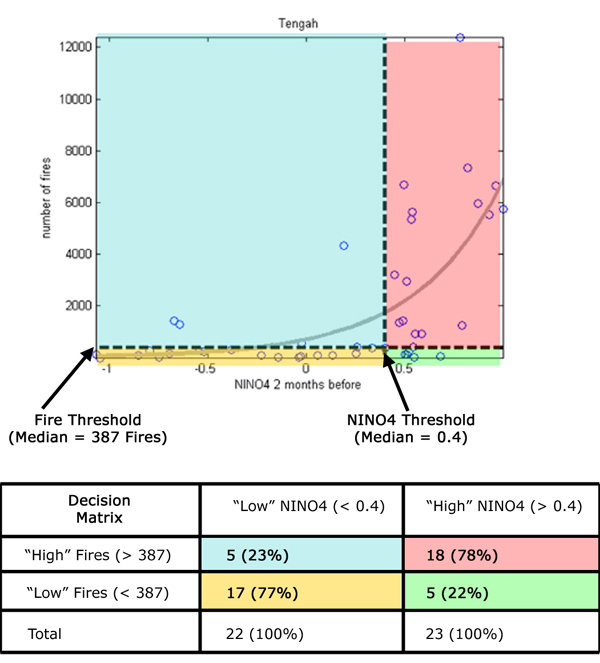
First, it is crucial to understand the past relationship between fires and SST in order to use this information to predict the future. A scatterplot is a simple way of viewing this relationship. Each circle in the scatterplot (Figure 11) represents a month’s fire activity in Central Kalimantan plotted against the NINO4 SST value from 2 months earlier (called a 2 month lag). The NINO4 Index uses April to September temperature anomalies (difference from average), that range from roughly -1C (cooler than average) to +1C (warmer than average).
What is the relationship between SST and fire?
Looking at the location of points on the scatterplot, we can see that months with high fire activity are usually accompanied by higher NINO4 values. Lower NINO4 values tend to have low fire activity. The curved regression line illustrates this nonlinear relationship. Note that the large scatter of points about the regression line means that the relationship is imperfect and “noisy,” and this uncertainty should be represented by a range of possibilities.
Creating a Probabilistic Forecast Model
What is a decision matrix?
A decision matrix provides a simple and illuminating way to make a forecast model based on scatterplot. To make a decision matrix, first the scatterplot data must be separated into four categories, or quadrants, by introducing threshold values for NINO4 (vertical line) and the number of fires (horizontal line). In this example, the median value for each data set is used, so the NINO4 value can be categorized as “high” or “low” based on whether they are above or below the median of 0.4. Similarly the number of fires is categorized as “high” or “low” based on whether it is above or below the median (387 fires in the case of Kalimantan). Next we build the decision matrix by reporting the number of data points (circles) in each quadrant, and converting this to a percent.
| Decision Matrix | Low NINO4 | High NINO4 |
|---|---|---|
| High Fires | ||
| Low Fires | ||
| Total |
How can a decision matrix be used as a forecast model?
Looking at this decision matrix (Figure 12), we can see that when the NINO4 value is above median (>0.4) that 18 out of 23 times (78% of the time) the number of fires was also above median (more than 387 fires). These values are highlighted in pink in both the scatterplot and the decision matrix. When the NINO4 value was below the median threshold, 17 out of 22 times (77% of the time) the number of fires was below the median of 387.
Using NINO4 Index to Forecast Fire Activity
How can I use this decision matrix to make a probabilistic forecast?
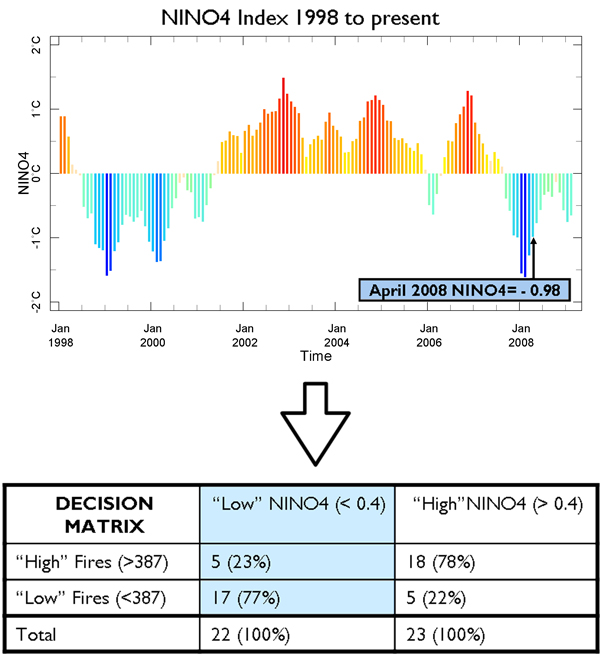
To make a forecast you must “fit” the current NINO4 value to the decision matrix forecast model (specific for the province and lag of interest). For example, let’s say it is April 2008 and the NINO4=-0.98. This is below the NINO4 median threshold of 0.4. Looking at the decision matrix “low” NINO4 column (Figure 13 - highlighted in blue), when NINO4 values are below 0.4, we can see that 17 out of 22 times in the past (77% of the time) there was a “low” number of fires (less than 387 fires) and 5 out of 22 times in the past (23% of the time) there was a “high” number of fires (more than 387 fires). Using this model, we can forecast that there is a 77% chance, or probability, that the number of fires will be “low” (less than 387 fires) in June 2008 based on a NINO4 of -0.98 in April 2008.
Can I choose different thresholds?
The median was chosen for this example for convenience, and also because it reduces the sampling variability of the estimated probabilities to a minimum. This is especially important in this experimental forecast, because only nine (5-month) seasons of data are available. However, the forecast can be “tailored” to make it more useful to decision makers by choosing a different fire threshold, for example, 1,000 fires. Note that the median threshold for NINO4 appears reasonable because it is close to the value used to define an El Niño event (usually 0.5).
The Probabilistic Nature of the Forecasts
What is a probabilistic forecast?
A probabilistic forecast describes the “chance” of something happening, like a coin toss that has a 50% chance of heads and a 50% chance of tails. This is different from a deterministic forecast, which predicts only one specific number or outcome (choosing only heads OR tails in a coin toss). A probabilistic approach is often more useful than trying to predict one specific outcome because it gives decision makers more useful information, specifically - the level of uncertainty of the forecast, based on the uncertainly in the observed past relationship between NINO4 and the number of fires.
What are the forecast probabilities in this example?
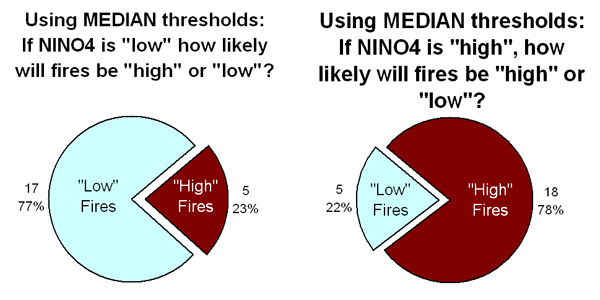
The probabilistic approach does not predict exactly how many fires there will be, only the “chance” of fires fitting into either the “low” fire category (less than 387 fires) or the “high” fire category (greater than 387 fires). In this case (Figure 14), we can say that an April 2008 NINO4 value of -0.98 allows us to a 77% chance of “low” fires, BUT there is also still a 23% chance that the number of fires could be “high.” Notice how these probabilities are different from the roughly 50% of a random coin toss, which we would expect if there were no relationship.
What does a 23% chance of “high” fires in June really mean?
It is important to understand probabilities before using the information for decision making. This does NOT mean that 23% of the province will experience fires, that 23% of forecasters predict fires, or that 23% of the month there will be fires. A 23% chance of “high” fires in June DOES mean that for months like June (when conditions are similar), there will be “high” fires 23 out of 100 times in the future (and inversely there will be “low” fires 77 out of 100 times in the future).
The “Predicting Fire Activity” Map Room
The forecast tool just described can be interactively used with this online tool . The online tool uses the same data and forecast model but the display looks slightly different.
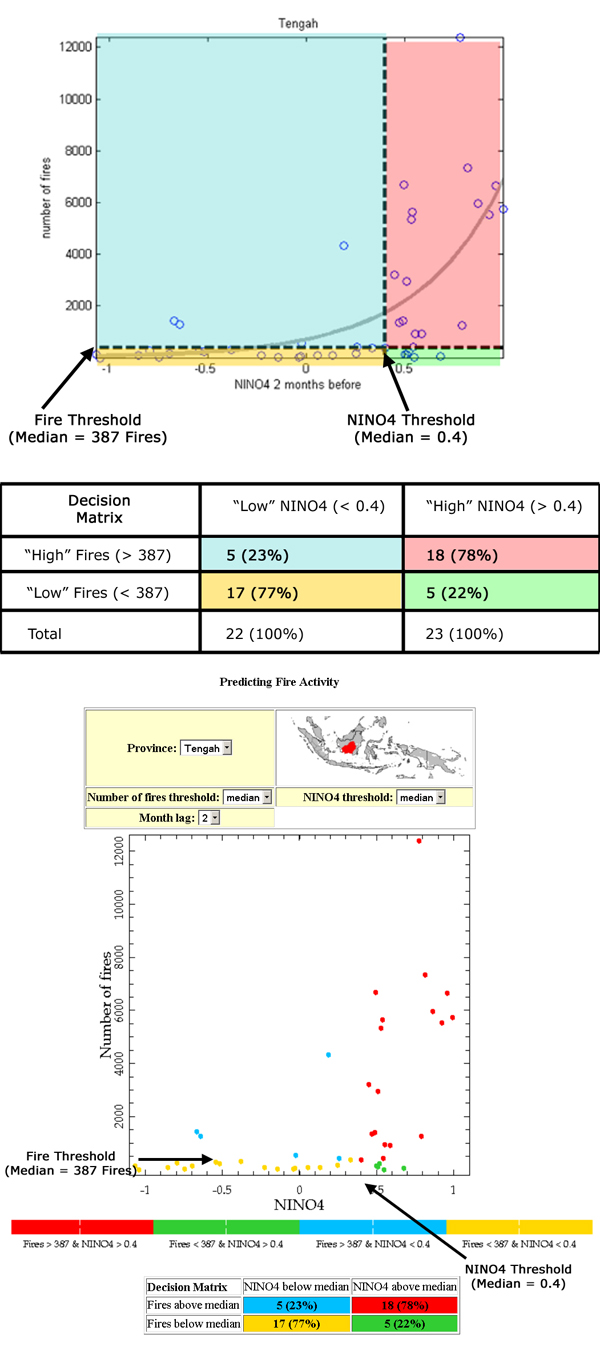
The scatterplot in the online map room uses colors instead of threshold lines to visually distinguish between the different categories, or quadrants of data. The scatterplot and decision matrix used in this document are color coded here (Figure 15) to help highlight the identical quadrants in the map room.
The online map room has interactive options for province, month lag and threshold choices for both fires and NINO4 values. The most recent NINO4 values are automatically updated on this website so you can create your own forecast with the most current information available.