Rainfall
The goal of this section is to understand the relationship between rainfall anomalies and fire activity at a provincial level in Central Kalimantan, and be able to use the Indonesia Rainfall Analysis Tool to identify recent rainfall activity.
Fire has long been an integral part of livelihood and development practices in Kalimantan as well as other parts of Indonesia, and is still used in many contexts. However, the spread of fires, particularly in peatland areas, is now recognized as a serious problem that causes economic losses. These fires are also a significant contributor to global carbon emissions. In Central Kalimantan, as well as other provinces, large areas of peatland have been drained and converted for agriculture, plantations and other land use, which are at greater risk of fire.
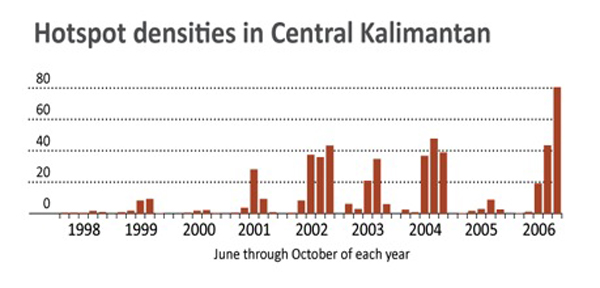
Fire activity varies from year to year, with some years witnessing a significantly higher number of fires than others (Figure 4). This suggests that while fires are related to human activity, there are other factors at work determining the severity of fires in a particular year.
Overview
What are the most important factors that determine how much fire there will be in a given year?
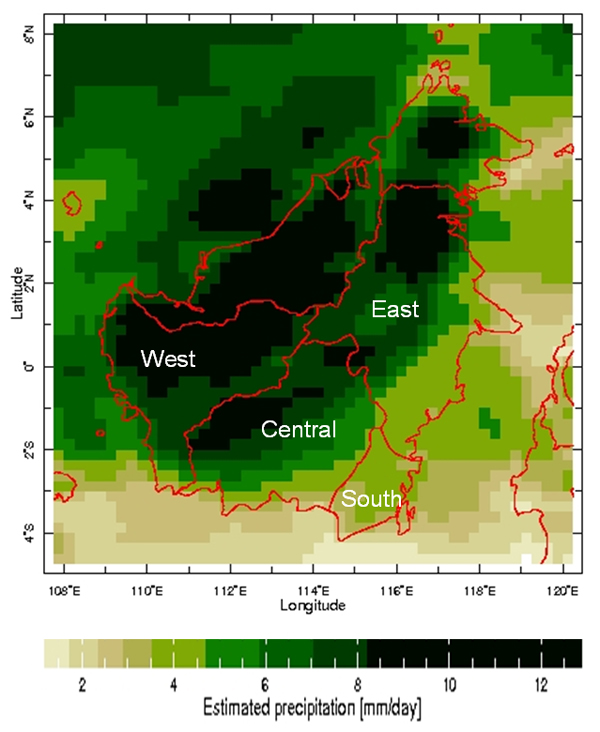
The four provinces of Kalimantan receive substantial rainfall throughout the year. However, there is a distinct ‘dry’ season from June through October (Figure 5) with an increase of precipitation from East to West Kalimantan. East and south Kalimantan regions are drier (especially during the months between June to November) than the central and west regions (Figure 6). Most burning activities are undertaken during this season as farmers and plantation owners clear land prior to planting in October or November.
However, even though fires are started every year during this season, the number of fires varies in each year. Analysis of the amount of rainfall and fire activity from 1998-2006 indicates that the amount of rainfall during any year has a significant bearing on the number of fires that are started. More specifically, years with below normal rainfall (rainfall below the average rainfall for the year) tend to have larger numbers of fires than years with above-normal rainfall.

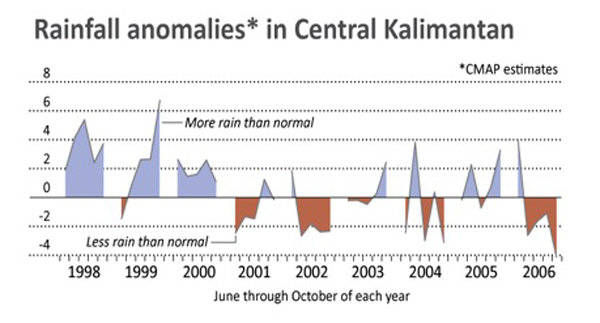
The following exercise demonstrates this relationship between using rainfall anomalies and fire hotspots. Monthly data on rainfall anomalies (calculated from total rainfall data from CMAP estimates) and fire hotspots from June 1998 to June 2007 are plotted to understand spikes in fire activity with a negative rainfall anomaly (lower than average rainfall) and decrease in fire activity occur during periods of positive rainfall anomaly (higher than average rainfall activity).
We begin by first plotting Rainfall Anomalies (Figure 7) and Hotspot Observations (Figure 8) for Central Kalimantan from June 1998 to June 2007.
In Figure 7, notice that periods of above average rainfall are shown as points above the 0-line (such as Aug-98 and Oct-99) and periods of below average rainfall are shown as points below the 0-line (such as Oct-02, Oct-04 and Oct-06).
Figure 8 shows the number of hotspots observed during the months in each year. Notice the significant inter-annual variability between the years with some years having lower hotspot density than others.
Do you see a connection between rainfall anomalies in Figure 7 and the number of fires in Figure 8? Look at years with less than normal rainfall (2002, 2006) and with more than normal rainfall (1999, 2005). What was the fire activity during these years as given in Figure 8?


Now look at these two graphs again in Figure 9, which is interactive.
Notice how points in the rainfall anomalies graph (negative rainfall anomaly) correspond with points in the hotspots graph (high fire activity) in Figure 9. This implies that periods of lower than average rainfall are associated with higher fire activity.
What does this indicate?
These results indicate that by monitoring rainfall anomalies, it is possible to estimate fire risk activity in the Central Kalimantan province. By monitoring rainfall anomalies we can thus identify regions with high or low risk of fire activity. This also implies that if we can forecast rainfall anomalies one to two months in advance, then we can forecast fire risk activity in advance with a lead-time of one to two months.
Rainfall Analysis Tool
The Rainfall Analysis Tool monitors the amount of rainfall in Indonesia and presents it in maps and location-specific time series. The rainfall estimates are taken from ‘CMORPH data’ from the U.S. Climate Predication Center which are updated every 8-11 days.
The tool provides information on the estimated dekadal precipitation (approximately averaged over 10 days) averaged over provinces and districts in Indonesia. Dekadal precipitation estimates can also be determined and presented for specific locations on the map through selection of the region of interest and also for different time periods by specifying the time period of interest.
For the specific area and time period chosen, the tool offers useful information on the rainfall patterns in the chosen area by comparing it with the average precipitation from previous years. Precipitation estimates for the current period are also compared with precipitation estimates from the previous three years. Taken together, the information presented by the tool can enable effective monitoring and understanding of the current rainfall pattern for the season.
The following screencast details the steps involved in accessing and using information from the Rainfall Analysis Tool and understanding this information.
For optimal viewing:
Click on the YouTube logo on the bottom left of the control menu. Adjust the resolution to 1080p. View in full screen mode.
Using the Rainfall Analysis Tool in the IRI Climate and Fire Resource Map Room
