Vulnerability mapping with surveillance data
The 5-cluster map (Figure 5) was found to be most representative of what is expected in the field and is consistent with expert opinion. Five clusters were able to capture differences in both intensity and the seasonal dynamics of malaria incidence. This is particularly important in Eritrea as the coastal region is dominated by October-November-December (OND) rains as opposed to July-August-September (JAS) rains for the rest of the country. This analysis was able to differentiate distinct risk regions (groups of subzobas ) within the Red Sea coastal region of Eritrea as well as different intensities of transmission within the areas susceptible to the OND rainfall season.
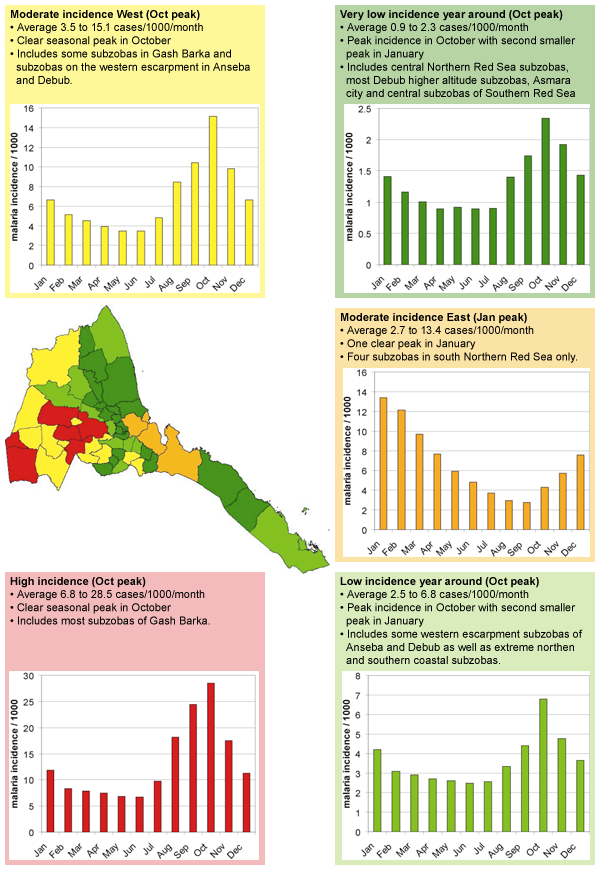
In addition to clarifying the seasonal pattern and intensity of transmission in different areas, the stratification map produced is useful for targeting and timing interventions such as indoor residual spraying to the highest risk areas.