Surveillance data
In many African countries, malaria data is collected at health facilities but often not looked at until they are summarized in the form of routine annual reports. Recently, many countries including Eritrea, have attempted to improve the collection and use of health facility data by updating health management information systems (HMIS). The aim is to improve estimates of the burden of disease at the national level while enhancing quality of care, accountability and decision making at the local level. Weekly surveillance data is particularly valuable for the detection of unusual situations, possibly an epidemic, which may require a prompt response.
Unfortunately, to date, there is very little information, which feeds back to the district level for improved decision making, thus undermining the incentives for improved reporting. Also, biases in data reported, which result from quality of service, drug availability, physical and social access and health seeking behavior, feed the widespread distrust of passive surveillance data collection as a tool in routine malaria decision making. Furthermore, for clinically diagnosed malaria cases, as opposed to those confirmed by laboratory diagnosis, there is often considerable overestimation of the case numbers as well as delays in appropriate treatment for non-malaria fever patients. Despite these limitations, many countries have no alternative but to make best use of the information available through passive health surveillance systems. Geographical and seasonal patterns of malaria transmission are usually clearly evident from such data.
For this study, we use the numbers of outpatient clinical malaria cases extracted from Eritrea’s National Health Management Information System (NHMIS). The data was published in Ceccato et al. 2007.
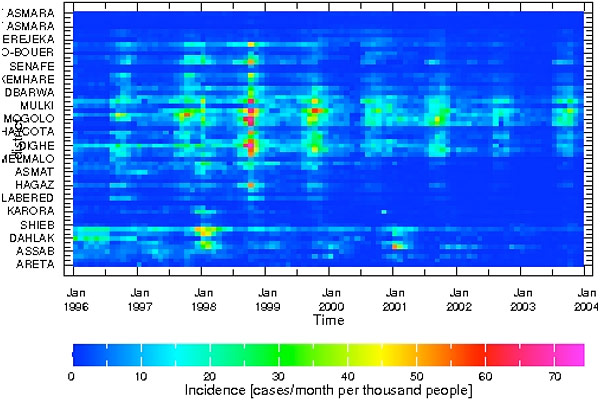
In this analysis, we use data from 242 selected facilities located in the 58 sub-districts, also called subzobas , in Eritrea. Malaria cases are summed over both age groups—under and over 5 years—by sub-districts and month. Malaria incidence per 1000 persons per month by sub-districts is estimated using the year 2000 population estimates in the NHMIS. The database by month and sub-districts for the years 1996 to 2003 are available in the IRI Data Library
The data can be visualized using the viewer icon in the data library (Figure 3).